




















How to Choose the C-Rate for a 261 kWh Battery Storage Cabinet
Sep 28, 2026
Leave a message

What this guide answers
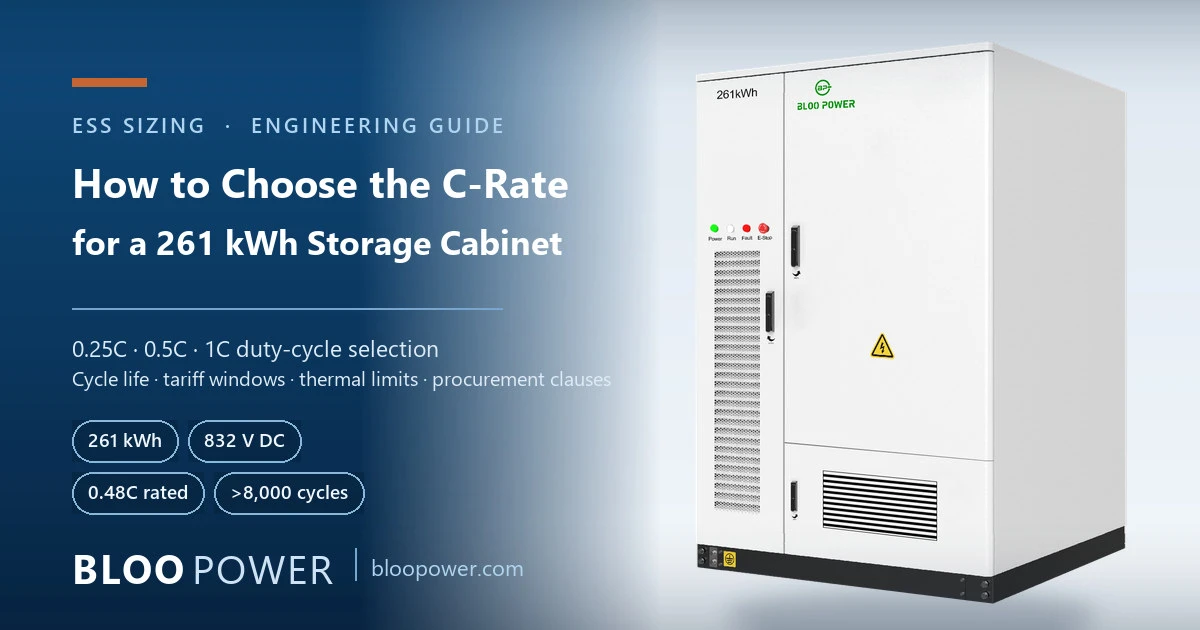
- Why a 261 kWh battery storage cabinet exists at all: 314 Ah cells in a 1P260S string give 261.2 kWh on an 832 V DC platform, and the enclosure is barely larger than the 215 kWh generation it replaced.
- Why the C-rate is a procurement decision, not a datasheet feature - the ceiling is set first by how long your high-value window lasts, then by how many kW of billable peak you actually need to remove.
- What 1C really costs: roughly half the cycle life of 0.5C, a 20–40% capital premium, more auxiliary load, and a thermal system that stops being optional.
- Why 0°C is the hard stop for charging at any normal rate, and why a specification that omits the low-temperature charge limit will under-deliver in its first winter.
- How to write the requirement so it survives commissioning: seven clauses, listed in §13, that together define how the number was measured.
Why this capacity became a standard building block
Start with the arithmetic, because it explains almost everything downstream. A lithium iron phosphate cell has a nominal 3.2 V. When the cell format moved from 280 Ah to 314 Ah, cell-count in a commercial cabinet had already converged on a 260-series string borrowed from utility-scale racks. Multiply through and you get 314 Ah × 3.2 V × 260 = 261,248 Wh ≈ 261 kWh. The previous generation used 280 Ah cells in a 240-series string - 215.0 kWh - so the capacity step is a cell upgrade inside an unchanged mechanical envelope.
That is what makes the 261 kWh battery storage cabinet commercially interesting. Enclosure footprint, transport method, lifting arrangement, pad requirements and grid interface stay roughly constant while usable energy rises about 21%. The fixed layer of project cost - civils, interconnection studies, switchgear, commissioning labour - is spread over a fifth more billable kilowatt-hours. Lazard's LCOS work draws the same conclusion from the other direction: for short-duration systems, capital cost dominates the levelised cost of storage, while charging cost dominates at long duration. Anything that dilutes capex per delivered kilowatt-hour therefore moves the answer more than another point of cell efficiency.
Market data supports the trend. BloombergNEF measured global turnkey BESS prices at about $117/kWh in 2025, down 31% in a single year, with the average falling to $124/kWh at two-hour duration and $110/kWh at four - and cell oversupply from a softer EV market is part of the reason. NREL's 2025 update models a four-hour utility-scale installation at $334/kWh in 2024 dollars on a fully loaded US basis, a deliberately conservative ceiling rather than a market price. Both numbers describe the same industry from different scopes. The practical consequence for a buyer is that the cheapest kilowatt-hour is the one you can actually dispatch, which is where the C-rate argument begins.
What a C-rate means inside a 261 kWh battery storage cabinet
rate is a normalised way of expressing current. One C is the current that would empty the battery in one hour, so C-rate = charge or discharge current (A) ÷ rated capacity (Ah). At 1C the pack empties in one hour, at 0.5C in two, at 2C in thirty minutes, at 0.25C in four. The advantage of the convention is that it travels between differently sized products; the disadvantage is that engineers think in kilowatts, and the two must be reconciled explicitly or the conversation goes wrong.
Inside this enclosure: 314 Ah of rated capacity on an 832 V nominal DC platform. One C is therefore roughly 314 A and about 261 kW; 0.5C is roughly 157 A and about 130 kW. BLOO POWER's cabinet ships with a 125 kW power conversion system, which works out to 0.48C at the enclosure level, with a short-duration peak of 137–138 kW and a 160% AC overload capability for motor-start or transformer-inrush events.
The distinction that matters most is the one most often glossed over: C-rate is a cell- and string-level property; the P/E ratio is a system-level one. A 261 kWh cabinet with a 125 kW inverter is a 0.48P system. If the PCS is smaller than what the cells could sustain, the station rate is capped by the inverter. If the PCS is oversized, the cells cap it instead. When a supplier quotes "1C", ask which layer that number describes - cell, string, enclosure or point of interconnection.
There is also a duration convention worth naming, because proposals mix the two freely. In North America and Europe, storage is described by duration - a "two-hour system", a "four-hour system" - while in much of Asia the same product is described by C-rate. They are reciprocals: a two-hour system is a 0.5C system, a four-hour system is 0.25C, a one-hour system is 1C. NREL makes the point bluntly in its costing methodology: inverters scale with power while cells scale with energy, so a dollars-per-kilowatt-hour figure quoted without a duration attached tells you almost nothing.
The load profile decides, not the datasheet
Most C-rate mistakes are sequencing mistakes. A cabinet is selected, then someone checks whether the power is adequate, and the answer is either no or - worse for the balance sheet - yes with a large permanent margin nobody needed. The defensible order runs the other way, and it starts with interval data rather than a product catalogue.
Pull at least twelve months of 15-minute demand data, ideally 5-minute for sites with fast load swings. Extract four numbers: the annual maximum demand, the average load during the high-price window, the duration of that window, and the frequency with which a short spike sets the monthly bill. Then compute the power the battery must supply:
P = high-price-window load − target billable peak
and the energy required to hold that power for the window:
E = P × window duration ÷ (depth of discharge × round-trip efficiency)
The C-rate then falls out as P ÷ E. A worked example: if the site must shave 130 kW for two hours at 90% usable depth and 88% system efficiency, E ≈ 130 × 2 ÷ 0.79 ≈ 329 kWh - more than one cabinet, so two 261 kWh units in parallel, or a larger enclosure. Shave 100 kW instead and E ≈ 253 kWh, which one cabinet covers at about 0.38C, leaving genuine headroom rather than waste.
Two corrections get skipped and both are expensive. The first is coincidence: the window average is not the peak within the window, and demand charges bill the highest interval, not the average. The second is simultaneity across a site with several large loads - compressor cycling, EV chargers, HVAC ramp-up - which can stack within one 15-minute interval and redefine the whole requirement. This is why a serious proposal is built from interval data and a dispatch simulation, not from a rule of thumb. BLOO POWER runs the customer's own load profile through the EMS dispatch model before proposing a capacity or a rate, so the cabinet count and the C-rate come out of the same calculation instead of being asserted separately.
Tariff windows set the ceiling
The physical ceiling on C-rate is not the cell's capability; it is how long the expensive window lasts. A battery that can discharge at 1C but only has a 45-minute window to earn in is a battery earning 45 minutes of value per cycle. Conversely, a 0.5C cabinet that exactly covers a four-hour on-peak block is doing the maximum useful work per unit of capital.
Western tariffs make this concrete in two different ways. Price-based structures - the time-of-use rates that dominate California, New York and much of the EU - pay for kilowatt-hours shifted, with typical off-peak to on-peak spreads of $0.08–$0.20/kWh and California evening peaks exceeding $0.25/kWh on hot days. Capacity-based structures - demand charges, common across PJM, ERCOT, ISO-NE and the Southeast - pay for kilowatts suppressed, and those are set by the single highest 15-minute interval in the billing period. Demand charges account for 30–50% of a commercial electricity bill in high-rate territories, at $10–$35 per kW-month depending on region: $22–$38 in California, $28–$42 in New York, $18–$32 across PJM, $15–$28 in ERCOT. Some tariffs add a ratchet, so one unmanaged spike in January sets the charge for the following eleven months.
Those two structures push in opposite directions. Arbitrage rewards duration, because it monetises kWh and a two-hour system with two daily cycles moves more energy than a one-hour system with one. Demand charge management rewards power, because it monetises kW and the event may last only minutes. A site sitting on a capacity-based tariff with a narrow, spiky load profile is the one case where paying for 1C is rational - and §9 works that case through properly. Chart 2 shows both structures on one timeline, with the dispatch pattern each one implies.

A 24-hour commercial tariff with a coincident demand-charge window, and the dispatch each C-rate implies. Prices are illustrative of a US commercial TOU structure; demand-charge ranges by region from the 2026 market snapshot ($10–$35/kW-month across North America). Sources: Lazard LCOS v10.0; behind-the-meter demand-charge benchmarking compiled from US utility tariffs.
The cycle-life bill for 0.5C versus 1C
he most expensive property of a high C-rate never appears on a quotation. Published cycle-test summaries for LFP stationary systems put expected life at roughly 6,000 cycles at 0.5C, about 3,000 at 1C and roughly 2,000 at 2C, all measured at 80% depth of discharge to an 80% capacity-retention endpoint. A single step from 0.5C to 1C therefore halves the number of cycles the asset can deliver, which is a larger number than the capital premium. A separate 18650-format cycling study points the same way from a different direction: after 300 cycles, capacity fade reached 18.8% at 2C, 14.2% at 1C and 10.5% at 0.5C.
The mechanism is well understood. Higher current increases polarisation and internal resistance, thickens the solid-electrolyte interphase on the anode, accelerates electrolyte decomposition and blocks lithium-ion diffusion pathways. The asymmetry matters commercially: fast charging damages more than fast discharging, because lithium that cannot intercalate into graphite fast enough plates onto the anode surface as metallic lithium, and that capacity never returns. Most cell datasheets therefore state a narrower charge window than discharge window, and that asymmetry is the reason.
Standards encode the same trade-off. GB/T 36276, China's national standard for lithium-ion batteries in electrical energy storage, requires 0.5C, 1C and 2C discharges to deliver at least 95%, 90% and 85% of rated capacity respectively - a higher rate yields measurably less energy from the same pack. Its 2023 revision also moved the cycle-life test to 45°C ambient, which is closer to real cabinet conditions and materially harder than a 25°C bench test. The 18650 study above sits in the same conclusion: rate, temperature and depth all push in the direction of faster fade.
BLOO POWER's liquid-cooled cabinet states more than 8,000 cycles at 80% depth of discharge under a 0.5C duty, with a published band of 8,000–10,000 cycles over 80–90% depth. On a single daily cycle that is a design life beyond twenty years; on a two-cycle-per-day schedule it is still a decade of service. Run the same hardware at 1C continuously and that published curve no longer applies - which is why a warranty that names an annual throughput cap in MWh is worth more than a warranty that names years alone.

Cycle life against duty C-rate for LFP stationary systems. Bar values are the midpoint of published industry test ranges rather than a single cell's measured data; real lifetime depends on chemistry, depth of discharge, ambient temperature and charge-termination policy. Sources: SunLith Energy and Redway cycle-test summaries; GB/T 36276 rate-performance requirements.
Efficiency and auxiliary load
A higher C-rate also taxes the conversion chain. Published figures put 0.5C discharge at close to 95% energy-delivery efficiency, while 1C discharge costs five to ten percentage points and leaves the system in the 90–93% band. That difference is not cosmetic at commercial scale. On a 261 kWh cabinet cycling 330 days a year, every additional point of round-trip efficiency returns roughly 260 kWh of deliverable energy annually; at a $0.20/kWh spread that is about $52 per cabinet per year, and it multiplies over a decade and across a cabinet fleet.
Auxiliary load is the same story told from the meter's side. Cabinets carry parasitic demand for thermal management, fire suppression, BMS, EMS and communications, and thermal management dominates. This is where liquid cooling earns its place. BLOO POWER's 261 kWh cabinet holds cell-to-cell temperature spread to ≤3°C, against 5–10°C typical for forced-air designs. A tighter spread matters because the hottest cell in a string ages fastest, and string capacity is limited by its weakest member - so a 7°C spread silently surrenders usable capacity and warranty headroom.
Field evidence backs the mechanism, if not the exact magnitude. A 2.5 MW / 10 MWh industrial installation in Jiangxi, China, reported cell-to-cell spread of ±2°C and AC-side round-trip efficiency steady at 90.5% across eight months of operation, with annual peak-valley revenue more than 12% above a comparable air-cooled specification. A manufacturing site in Zhuhai running two 125 kW / 261 kWh liquid-cooled cabinets measured auxiliary consumption roughly 30% lower than an air-cooled equivalent. These are vendor-published Chinese project results and should be read as such, but the direction is consistent with the physics.
The design consequence is worth stating plainly: the C-rate you choose decides whether liquid cooling is an optimisation or a precondition. At 0.5C, liquid cooling buys efficiency and life. At 1C it becomes the thing that prevents summer derating from erasing the revenue case - the thermal system stops being a line item you can trade away for a lower quotation.
Temperature is the real ceiling
If C-rate is a dial, temperature is the frame around it. The charging window for LFP cells is typically 0 to 45°C (32 to 113°F), and some datasheets extend it to 55°C (131°F). The reason is chemistry rather than caution: below freezing, lithium ions cannot diffuse into the graphite anode quickly enough to intercalate, so they reduce onto the anode surface as metallic lithium. Lithium plating is cumulative and permanent, reduces usable capacity, and in severe cases forms dendrites that can puncture the separator. Practical limits used across the industry: charge at no more than 0.1C between 0°C and −10°C (14°F), no more than about 0.05C below −10°C, or heat the pack first; below −20°C (−4°F), do not charge unless the system has active heating. The BMS should open the charge path in hardware when the threshold is crossed - not merely raise an alarm.
Discharge is far more forgiving. Cold cells lose usable capacity without permanent damage: at −10°C (14°F) an LFP pack delivers roughly 75–85% of rated capacity, at −20°C about 55–70%, and full capacity returns on warming. The high end is the opposite problem: above 45°C side reactions accelerate, self-discharge rises, and the BMS tapers charge current to protect the cells. That is why liquid cooling is close to non-negotiable in hot climates rather than a premium option.
Two practical consequences follow, and both belong in the commercial model rather than in an appendix. First, in cold markets the usable energy assumed by a financial model must be discounted by the winter temperature curve, or the first-year revenue will miss. Second, the low-temperature charge limit and the heating strategy must appear in the technical agreement. Across lithium deployments this is the most common genuine failure mode: a system that performs to specification on paper and cannot charge for weeks in January. BLOO POWER's 261 kWh cabinet is rated for −20 to 45°C (−4 to 113°F) operation with low-temperature charge protection in the BMS protection set; a specific northern site still needs its heating power and its extreme-cold duration modelled, not assumed.
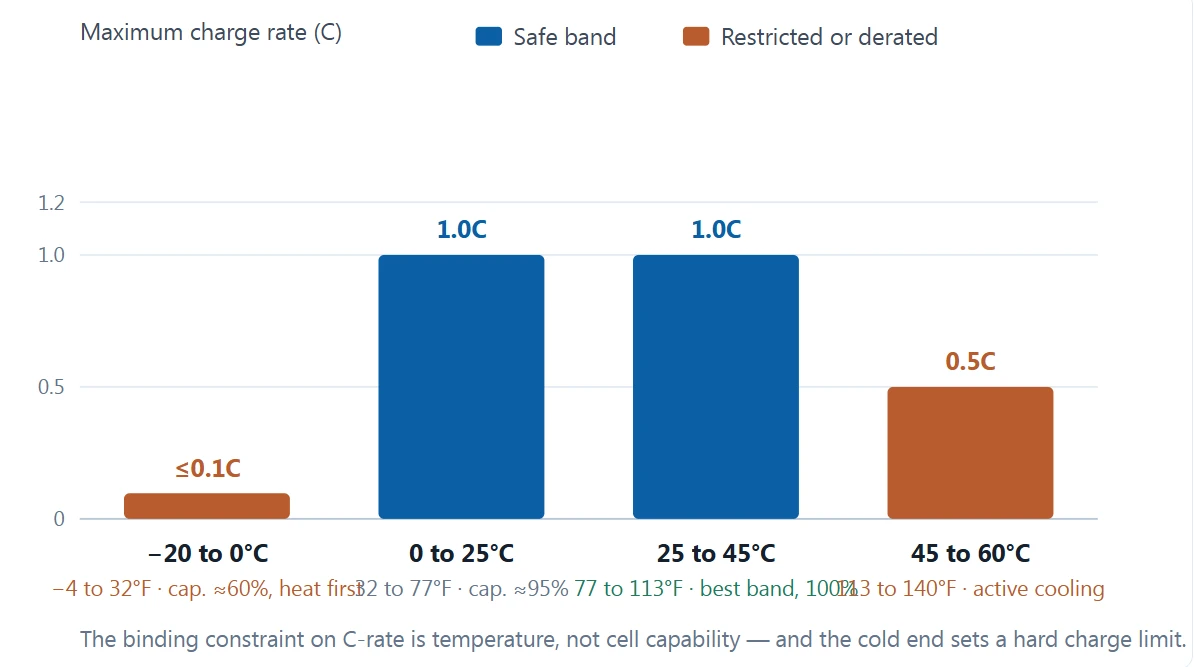
Maximum charge C-rate and usable capacity by temperature band for LFP cabinets. Charge limits are industry engineering practice consistent with mainstream cell datasheets, which typically specify a 0–45°C (32–113°F) charge window. Capacity values are approximate discharge retention at 0.5C. Confirm against the selected cell datasheet and BMS configuration. Sources: JMBatteries low-temperature charging protocol; Redway ESS charge-parameter guidance; Nxten Energy temperature-retention curve.
Matching the PCS to the pack
The C-rate a site actually gets is the lower of two capabilities: what the cells can sustain and what the power conversion system can deliver. BLOO POWER resolves the pairing by shipping a 125 kW PCS with the 261 kWh cabinet, giving about 0.48C at the enclosure, plus 160% AC overload for motor starting and 100% unbalanced load capability for sites where single-phase demand is heavy. Moving to a true 1C means far more than a bigger inverter. At 261 kW the DC-side current roughly doubles, so DC busbars, fuses, contactors, cable cross-sections, terminal temperature rise and cabinet airflow all have to be re-verified together. The capital premium compounds because four subsystems move at once.
Oversizing in the other direction is equally wasteful. Projects that buy a 1C-class PCS "for future expansion" but dispatch at 0.4C pay for capability they never monetise, and they run their conversion chain at an unfavourable point on the efficiency curve. The useful rule is a floor, not a target: PCS rated power ≥ the site's required billable-peak reduction. Once that is satisfied, additional headroom belongs in additional cabinets, where it also buys energy, rather than in a larger inverter that buys only power.
BLOO POWER 261 kWh liquid-cooled cabinet against the 215 kWh generation
|
Parameter |
ESS 261 kWh / 125 kW liquid-cooled cabinet |
215 kWh cabinet |
|
Cell |
LiFePO₄ 314 Ah (1P260S) |
LiFePO₄ 3.2 V / 280 Ah (1P240S) |
|
System capacity |
261 kWh |
215 kWh |
|
Rated DC voltage / range |
832 V DC / 679–936 V |
768 V DC / 600–876 V |
|
PCS rating |
125 kW (peak 137–138 kW) |
100 kW |
|
Enclosure P/E ratio |
≈0.48C |
≈0.47C |
|
Cycle life |
>8,000 cycles at 80% DOD (8,000–10,000 published band at 0.5C) |
Long-cycle LFP design |
|
Thermal management |
Liquid cooling, cell-to-cell spread ≤3°C |
Air or liquid cooling |
|
Peak conversion efficiency |
99.0% (THDi <3%) |
>96% round trip |
|
Operating temperature |
−20 to 45°C (−4 to 113°F) |
−15 to 55°C (5 to 131°F) |
|
Ingress / corrosion |
IP55; C3 / C4 / C5 optional |
IP55 |
|
Fire suppression |
Perfluorohexanone plus water sprinkler |
Heptafluoropropane |
|
Dimensions (W × H × D) |
1,465 × 1,351 × 2,040 mm (58 × 53 × 80 in) |
1,250 × 1,250 × 2,500 mm (49 × 49 × 98 in) |
|
Communications |
CAN / RS485 / Ethernet (Modbus RTU / TCP) |
Ethernet / RS485 |
|
Certifications listed |
UN 38.3 / MSDS / CE / IEC / FCC |
- |
|
Expansion |
Parallel to 1.25 MW / 2.61 MWh; grid-tied peak shaving or off-grid supply (optional STS) |
Parallel banks to MWh scale |
Source: BLOO POWER published product parameters (ESS 261 kWh 125 kW liquid-cooled C&I storage; 215 kWh BESS). The enclosure P/E ratio is the PCS rating divided by system capacity and is not the cell's maximum rate. Confirm against the project technical agreement and the final revision of the datasheet.
LCOS, capital cost and payback
Capital cost, levelised cost and payback move in different directions as the C-rate rises, which is why a single quotation cannot settle the question. Lazard's LCOS v10.0, published in June 2025, gives a clean frame: a 100 MW two-hour standalone system lands between $129 and $277/MWh (falling to $95–$209 with the investment tax credit), a 100 MW four-hour system between $115 and $254/MWh ($83–$192 with ITC), and a 1 MW two-hour commercial system between $319 and $506/MWh ($249–$396 with ITC). Since 2020, four-hour utility-scale LCOS has fallen about 5%, while two-hour commercial has fallen about 20%.
The structural insight inside those numbers matters more than the values. Lazard's component split shows capital cost dominating the levelised cost of short-duration storage, while charging cost dominates at long duration. Push a system toward higher power for the same energy - that is, toward 1C - and you concentrate the cost stack where capital dominates, which is exactly where a higher C-rate hits hardest: bigger power electronics, heavier busbars, more thermal capacity, and a shorter replacement interval that reappears as capital again in year seven or eight. Push toward 0.25C and capital per kilowatt-hour falls, but each delivered kilowatt-hour carries more charging cost and a longer payback tail.
Commercial-scale paybacks in Western markets cluster in a range that reflects tariff design more than equipment. Behind-the-meter storage in high-demand-charge markets - California, New York, Massachusetts, and pockets of Texas and PJM - typically shows two to six year paybacks, with three to five years common once the 30% investment tax credit is applied; lower-tariff regions run five to eight years. Demand-charge savings usually exceed energy-arbitrage value by a factor of two to four at sites whose billing peak is set by a single 15-minute interval, while arbitrage typically adds 5–15% of annual revenue unless the spread is wide. That ranking is the single most useful input to the C-rate decision: if demand charges are the primary revenue line, power matters and 1C can pay; if arbitrage or self-consumption is primary, duration matters and 0.5C wins.
Technical and economic comparison across 0.25C, 0.5C, 1C and 2C
|
Dimension |
0.25C |
0.5C |
1C |
2C |
|
Duration at full power |
4 hours |
2 hours |
1 hour |
30 minutes |
|
Power from a 261 kWh cabinet |
≈65 kW |
≈130 kW |
≈261 kW |
≈522 kW |
|
Typical cycle life at 80% DOD |
≈8,000 |
≈6,000 |
≈3,000 |
≈2,000 |
|
Rate-discharge capacity (GB/T 36276) |
- |
≥95% of rated |
≥90% of rated |
≥85% of rated |
|
Energy-delivery efficiency |
close to 95% |
close to 95% |
90–93% |
materially lower |
|
Turnkey price evidence |
≈$110/kWh (4-hour, BNEF 2025) |
≈$124/kWh (2-hour, BNEF 2025) |
Higher - power electronics and thermal set the cost below 2 hours |
Highest; high-power cells plus forced liquid cooling |
|
Relative capital index |
100 |
≈115 |
≈140–160 |
≈180–230 |
|
Thermal requirement |
Air cooling viable |
Air or liquid cooling |
Liquid cooling effectively required |
High-performance liquid cooling, power cells |
|
Dominant LCOS component (Lazard) |
Charging cost |
Balanced |
Capital cost |
Capital cost |
|
Typical application |
4-hour shifting, renewable curtailment capture |
C&I two-cycle arbitrage, self-consumption, standalone storage |
Short on-peak capture, demand-charge reduction, frequency response |
Frequency regulation, data-centre backup, ultra-fast charging buffer |
Price evidence: BloombergNEF Energy Storage Systems Cost Survey 2025 (global average turnkey $117/kWh; $124/kWh at two-hour, $110/kWh at four-hour duration; regional averages $73/kWh China, $177/kWh Europe, $219/kWh US). Cycle-life values are midpoints of published industry test ranges at 80% depth of discharge. The relative capital index is an order-of-magnitude planning aid, not a quotation. Lazard LCOS v10.0 (June 2025) provides the component-dominance split. Costs vary widely with scale, region, tariffs and interconnection.
When 1C is genuinely the right answer
Most commercial projects do not need 1C, and saying so plainly is more useful than implying that higher is better. Two situations do justify it. The first is a billable peak that cannot be cut without more power than a two-hour system can deliver. Worked in demand-charge terms: a cold-storage or distribution facility peaking at 380 kW on a $28/kW-month tariff pays $10,640 a month for that peak. Shaving 80 kW consistently drops the bill by about $2,240 a month, or roughly $27,000 a year. If the spike that sets the peak lasts twenty minutes, a 0.5C cabinet rated 130 kW is already sufficient; if the site needs to remove 200 kW, a single two-hour cabinet cannot do it, and the choice is either two cabinets or one at 1C.
The second situation is a short, high-value window. Where the on-peak block is 60 minutes and the spread is wide, a two-hour system can only monetise half its energy in that window and must sell the rest at a lower price. A one-hour system captures the whole spread on the same capital, at the cost of half its cycle life. This is a real trade, but it is decidable: divide the extra annual arbitrage or demand-charge revenue by the incremental capital cost of the higher rate, and compare the result against the cost of the earlier replacement that the shorter cycle life implies.
There is a third, more nuanced case: seasonal power requirements. Factories in climates with a pronounced summer peak may need 1C-class power for three months and only 0.5C for the rest of the year. Buying 1C for the whole fleet is the expensive answer. A mixed configuration - mostly 0.5C cabinets with a small number of high-power units for peak weeks - captures the value without paying the cycle-life penalty on every enclosure. Dispatch software is what makes that configuration work, which is why BLOO POWER's EMS optimises charge and discharge against time-of-use rates, solar forecasts and the site's load profile, and why the cabinet carries multi-protocol communications rather than a single-vendor interface.
Trading the SOC window for life
There is a second life-extending lever that costs nothing if you accept its trade. GB/T 36276's shallow-cycling test - 0.5C, state of charge between 20% and 80%, 25°C - demands at least 90% capacity retention after 10,000 cycles, nearly double the 6,000-cycle expectation of a full-window duty at an 80% retention endpoint. The mechanism is mechanical as much as electrochemical: limiting the extent of lithium extraction and insertion reduces structural stress on the electrode particles and slows interphase growth.
For a commercial site this presents a direct choice. Narrowing the usable window from 0% to 100% down to 5%–95% (90% depth) or 10%–90% (80% depth) extends service life with no hardware change, at the cost of roughly 10–15% of daily deliverable energy. Whether that trade is profitable depends on the revenue mix. On a pure arbitrage duty priced per kilowatt-hour, giving up 12% of throughput to gain years of life has to clear a straightforward arithmetic test. Where the system also carries demand-charge or resilience value - revenue that is not proportional to throughput - the life extension usually dominates, because capacity that still works in year twelve is worth more than the kilowatt-hours forfeited in year one.
The practical middle ground for most commercial projects sits around a 5%–95% window at 0.5C with liquid cooling, which lands in the 8,000-cycle class and matches what manufacturers actually warrant. BLOO POWER states the 261 kWh cabinet's cycle life at 80–90% depth of discharge, and the BMS carries over-temperature, low-temperature charging, over-current, short-circuit, over-voltage, under-voltage and DC-bus protection - so window management is enforced by the system rather than by operational discipline. Treat the window as a specification parameter, not a commissioning preference.
What paralleling cabinets does to the rate
Single-cabinet C-rate and fleet C-rate are different quantities, and confusing them is one of the more common engineering errors in an expansion design. BLOO POWER's cabinet parallels to 1.25 MW / 2.61 MWh, which is ten units - and each one still runs at about 0.48C, because each keeps its own inverter and the AC sides are paralleled. The fleet rate does not fall as the fleet grows. The opposite is true if cabinets share a single central PCS or draw on a constrained interconnection: then the station rate is set by the shared converter and the point of connection, and the cells' capability is left partly unused.
AC-side paralleling also opens an option that pure hardware sizing cannot offer: mixed-rate dispatch. Half the fleet can run a daily two-cycle arbitrage pattern at 0.5C while the remainder stays idle except for the annual peak weeks, when it discharges at higher power. Total capacity is unchanged, but the station now earns both a throughput revenue and a peak-reduction revenue without buying high-power hardware for every enclosure. This is a software trade - trading dispatch intelligence against capital - and it only works when the control layer can address cabinets individually and react in real time. BLOO POWER cabinets expose CAN, RS485 and Ethernet with Modbus RTU and Modbus TCP, and the local controller handles monitoring, policy configuration and remote upgrade, which is the plumbing that mixed-rate dispatch requires.
One caution belongs here as well. Parallel operation changes the failure-mode analysis, not just the economics. A larger single PCS is a larger single point of failure than a set of independent inverters, and the redundancy story should be settled at the same time as the C-rate - before the one-line diagram is frozen rather than after a commissioning surprise.
Six project types, six answers
The analysis above collapses into a short list. Treat these as starting positions that a site-specific simulation should confirm, not as substitutions for one.
Manufacturing plants on two-cycle arbitrage.
On-peak blocks of two to four hours with a billable-peak reduction of 100–150 kW: specify 0.5C and build from one to four 261 kWh cabinets in parallel. This is the configuration where the format's economics are strongest, and it is why two-hour duration dominates commercial storage globally.
Retail, hospitality and commercial buildings.
Loads are dominated by an evening ramp and HVAC cycling, and the site may be noise-sensitive or close to occupied space: 0.5C is sufficient, and the sizing question moves to thermal architecture and acoustic rating (BLOO POWER's cabinet is published at <75 dB) rather than to power.
Sites with a transformer limit and a high demand charge.
Where the required peak reduction exceeds what a two-hour system can supply, either add cabinets or specify 1C with a matching PCS. Revenue here is capacity-dominated, so the payback is less sensitive to throughput and more sensitive to how reliably the peak is held - which makes dispatch reliability, not efficiency, the thing to verify.
Sites with a short, expensive window.
A 45–60 minute on-peak block with a wide spread: 1C, accepting roughly half the cycle life, provided the incremental revenue repays the earlier replacement. Model it explicitly rather than assuming.
EV charging hubs and depots.
The objective is usually transformer relief and buffering of charger inrush rather than arbitrage: 0.5–1C, with attention to overload capability and, where the site also needs resilience, to on-grid/off-grid transfer. A hybrid AC/DC-coupled arrangement is often the right architecture; BLOO POWER publishes AC-coupled, DC-coupled and integrated hybrid configurations for exactly this reason.
Microgrids, weak grids and backup duty.
Load steps are large and unbalanced: 0.5C as the baseline, verified against 100% unbalanced-load and off-grid operation rather than against an efficiency curve. If the requirement is data-centre or AI-facility backup, it belongs to a different class of product altogether - 2C and above, with power-optimised cells - and should not be specified from a commercial cabinet catalogue.
Writing the C-rate into a specification
Choosing the right rate and specifying it are separate skills, and the second one decides whether the first survives delivery. "Supports 0.5C" is not a requirement; it is a marketing sentence. The seven clauses below together define how the number was measured, which is the only version of the claim that can be verified on site.
C-rate clauses that belong in the technical agreement
Continuous C-rate and peak C-rate, with a duration attached to the peak.Not "high power", but "0.5C continuous; 0.53C for 10 seconds; 160% AC overload for 3 seconds".
The full test conditions behind any cycle-life claim. C-rate, depth of discharge or SOC window, ambient temperature and end-of-life capacity retention - all four, together. An 8,000-cycle claim at 25°C and 80% depth means something different from the same number at 45°C and 90% depth.
The operating temperature window including the low-temperature charge limit. State the charge-current threshold below 0°C, require hardware-level charge-path interruption by the BMS, and specify whether heating is included, at what power, and who pays for that energy.
How the depth-of-discharge window maps onto the warranty. Name an annual or lifetime throughput cap in MWh. A ten-year warranty paired with an unlimited daily two-cycle duty is a warranty that will not be honoured in year eight.
Round-trip efficiency with a derating curve. Require efficiency at 25°C, 35°C and 45°C ambient, and the available power at each - not a single best-point figure.
Thermal architecture and the maximum cell-to-cell temperature spread. For liquid-cooled systems, state the spread at full load (≤3°C is the normal engineering target) and the method by which it will be demonstrated.
The certification list, separated into what the supplier holds and what the project requires. UN 38.3 and MSDS for transport; IEC 62619 for industrial lithium safety in Europe, Australia and much of Asia; UL 1973 for the battery subsystem and UL 9540 for the complete system in North America, with UL 9540A thermal-runaway test data where the authority having jurisdiction asks for it. UL 9540A is a test method producing data, not a product certificate - conflating the two is a common source of procurement argument. NFPA 855 then governs siting, separation and fire protection, and in the EU, Regulation (EU) 2023/1542 adds a carbon-footprint declaration for industrial batteries above 2 kWh and a digital battery passport from 18 February 2027, with the passport requiring a live data connection to the BMS.
Standards and certifications, and how each one touches the C-rate decision
|
Standard / scheme |
Layer |
Where the C-rate decision meets it |
|
GB/T 36276 (2018 / 2023) |
China national standard, lithium-ion batteries for electrical energy storage |
Rate-discharge capacity thresholds (≥95% / 90% / 85% of rated at 0.5C / 1C / 2C); energy efficiency floors of 88% for energy-type and 82% for power-type cells; the 2023 revision moved cycle testing to 45°C ambient |
|
IEC 62619 |
International safety standard for industrial lithium batteries |
Electrical, thermal, mechanical and BMS functional-safety requirements; the general-market baseline for Europe, Australia and Asia-Pacific. Current-limit logic at high rate is evaluated here |
|
UL 1973 |
North American battery subsystem safety |
Cell, module and pack safety under normal and abuse conditions including the BMS; over-current and thermal risk at high rate are verified at this layer |
|
UL 9540 / UL 9540A |
System safety certification / thermal-runaway fire propagation test method |
UL 9540 certifies the complete system; UL 9540A produces four-level test data (cell, module, unit, installation) that feeds NFPA 855 spacing, ventilation and suppression decisions. Commonly required for lithium systems above 20–50 kWh in North America |
|
NFPA 855 |
US installation code for stationary energy storage |
Separation distances, ventilation, detection and suppression at site level. Higher-power, higher-throughput cabinets typically attract larger separation and stronger detection requirements |
|
Regulation (EU) 2023/1542 |
EU Battery Regulation |
Treats stationary storage as an industrial battery: carbon-footprint declaration for units above 2 kWh, CE marking and conformity assessment, EPR registration, recycled-content mandates, and a digital battery passport from 18 February 2027 with dynamic state-of-health data drawn from the BMS |
|
UN 38.3 / MSDS |
UN transport safety testing for lithium batteries |
Precondition for sea, road and air freight. A missing report does not degrade performance; it stops the shipment and the project schedule |
Standard scopes follow UL Solutions, IEC and Regulation (EU) 2023/1542 as published. Chinese project work follows the current revision of GB/T 36276 together with local grid-connection acceptance requirements. Certification held by the supplier and documentation required by the project are distinct lists - keep them separate in the procurement file.
Five mistakes that keep showing up
Reading the PCS nameplate as the battery rating.
A 250 kW inverter on a 261 kWh enclosure does not make it a 1C system. The string's continuous rate, the DC busbar and fuse ratings, the contactor duty and the cabinet's thermal design are independent constraints. The same error appears in reverse when a cell datasheet's peak rate is read as a continuous one - peak and continuous are different numbers on the same page, and only the continuous figure belongs in a revenue model.
01
Assuming higher is better.
C-rate is a fit parameter, not a performance grade. On a site with a four-hour window and a modest peak-reduction requirement, 1C buys a power ceiling that will never be used, and pays for it with half the cycle life. Two-hour duration dominates commercial storage globally for exactly this reason.
02
Leaving the low-temperature charge limit out of the contract
This is the most common genuine failure mode in lithium projects rather than a theoretical one. A northern site specified without a charge-current threshold, a heating strategy and a BMS hardware interlock will spend the coldest weeks at a state of charge it cannot raise, and the first-year revenue will not match the model.
03
Using a peak rating in a continuous calculation
Short-duration peaks on the order of ten to sixty seconds exist to absorb starting currents. Writing that figure into a daily dispatch model systematically overstates deliverable energy per cycle, and the error compounds across a hundred cabinets and a thousand cycles.
04
Buying on unit price instead of levelised cost
A higher C-rate raises capital cost per kilowatt-hour, shortens service life and increases auxiliary consumption at the same time. Three effects pointing the same direction do not average out, and Lazard's own component analysis says capital cost dominates the levelised cost of short-duration storage - which is precisely the region a high C-rate moves the project into. Compare LCOS across candidate configurations, not dollars per kilowatt-hour of nameplate.
05
Where this format stops making sense
An article that only endorses its subject is advertising. So: the 261 kWh cabinet is the right building block within a certain envelope, and outside it another product is the honest answer.
Beyond roughly four hours of duration, it stops competing. A site that needs eight hours of shifting is better served by ground-up long-duration options - iron-air, flow, thermal or simply a larger container - because stacking fifteen or more cabinets to reach that duration multiplies balance-of-plant, cabling, pad area and interconnection work in a way that a single larger enclosure does not. The 261 kWh format's advantage is that it amortises fixed project cost over a modest energy block; scale past a few megawatt-hours and purpose-built containers do that job better. BLOO POWER's own range reflects the boundary, with 1 MWh, 3 MWh and 5 MWh containerised systems for utility-scale and park-level projects.
Below about 30 minutes of duration, it stops being the appropriate class. Very short, very high-power duty - data-centre bridging, ultra-fast-charging buffers, high-frequency regulation markets - needs power-optimised cells with continuous ratings well above 1C. That is a different cell chemistry specification and a different thermal design, not a higher setting on the same product. Applying the cabinet there means paying for energy capacity that is never cycled on time.
Where the C-rate has nothing to bite on. Sites on energy-only tariffs with flat, continuous loads have neither a demand charge to shave nor a wide spread to arbitrage: a 24/7 process line at steady state is the canonical example. Storage can still serve them - for resilience, for solar self-consumption, for participation in a demand-response or virtual-power-plant programme - but the argument shifts from power to duration and to the value of availability. Germany's market incentives for stationary storage, distributed-capacity procurement programmes from US utilities seeking to defer transformer upgrades, and demand-response payments of $15–$50/kW-month in mature programmes all move the economics onto a different axis.
Where the grid connection is the real limit. If the point of interconnection caps export or import, the binding constraint is a piece of paper, not a C-rate, and no cabinet specification resolves it. Settle interconnection capacity before finalising enclosure count and rate - this is where technically identical projects diverge by twenty percent on total cost.

Send twelve months of electricity bills and 15-minute interval data. BLOO POWER's engineering team will run the site through the EMS dispatch model and come back with a recommended capacity, a recommended C-rate and a payback calculation - a conclusion first, a cabinet second.
Send Inquiry